
MARKET STANCE (3-12 MONTHS): Bull Market
INFLATION FORECAST OVER NEXT 6 MONTHS: moderate inflation
INVESTMENT STANCE: 50% cash, 50% stocks
STOCK CRASH POTENTIAL (NEXT 1-6 MONTHS): LOW
ECONOMY: medium growth
Next Monthly Report: Feb 10

January 13, 2024
Disclaimer: Do not trade off of this advice. This blog is for informational purposes only. Any investment advice are just suggestions. The author has no experience working in the financial industry.
The official unemployment rate continues to be at historic lows. It was 3.7 percent in December, same as November. Total non-farm jobs openings tell a different story from the low official numbers, however. It has been falling steadily since March of 2022. This FRED graph is data from December 2000 to November 2023. Every decline in the number of job openings has occurred during a recession (shaded grey). So there is a major discrepancy between the official unemployment figures and the figure below. The economy is not as solid as you think.

The real estate market over the past year has been flat. The median price of existing homes sold has been flat for the past several months. I’ve written in the last monthly report that mortgage application were at the lowest level since the mid-1990s. That was due to skyrocketing mortgage rates and the fact that those who locked in when rates were low have been reluctant to sell. That will probably change as mortgage rates have fallen a full point from their peak in late October.
Home prices today are way out of line to the historic norms. The chart below shows both the median home price and inflation adjusted home prices from Jan 1954 to Oct 2023. For many decades inflation adjusted median home prices were fairly steady until 20 years ago. Today median home prices are roughly double what they were from the 1950s to the early 2000s.

Stocks
Back in December I changed my stance on the stock market. We are currently in a bull market. The major indices never saw the technical breakdown that I expected. The Dow Industrials, the NASDAQ, and the S&P 500 have all held above their moving averages. Their 50 day never crossed below their 200 day moving averages during the October and November selloffs. The historic volatile period for equities is over.


The Dow Transports and NYSE Composite have both turned up as well. Their 50 day MA is now above their 200 day MA. However there remains a non-confirmation between the Tranports and the Industrials, which is a Dow Theory violation. The Industrials made new highs while the Transports didn’t. Whether the Transports catches up to the Industrials remains to be seen.


Even the Banking Index has been showing signs of recovery as their bear market appears to be over.

Stocks are due for a pullback as they appear to be overbought. But the fact remains that stocks are incredibly overvalued compared to the historical mean. The chart below shows how much the average dividend yield has shrunk over the past 100 years. Stocks are a poor value today. It used to be that stocks were bought primarily for it’s dividend producing income. That’s not the case today as they are bought almost exclusively for it’s capital gains. The dividend yield currently on the S&P 500 stocks is at among it’s lowest level in history (see the May 2022 report for a more in-depth look).

Interest rates
The bear market for Treasuries appears to be over – for now. Interest rates have been dropping steadily for the past several months. This has buoyed stocks.
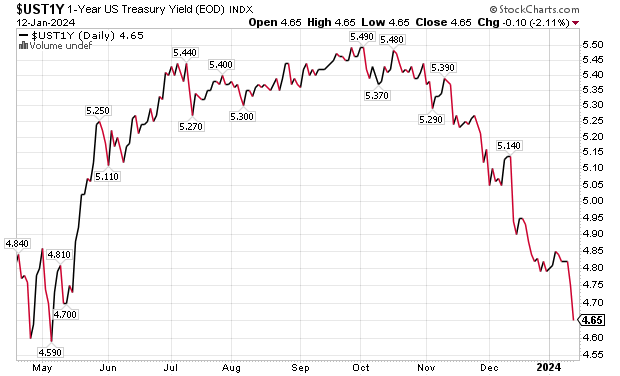

Bonds have already suffered their worst bear market in history, with the 30 year bond declining 40 percent in value over the past three years. A rally in bonds was long overdue. However I believe that interest rates over the long-term (5-15 years) are going to continue upward. The next couple of years may see rates decline.
See also:
The End of the 40-Year Bull Market in Bonds. What’s Next
R.I.P Bond Bull Market , 1981-2021
M2 Money Supply is Shrinking
Seldomly will you hear in the media that the money supply is actually shrinking, which is the first time sustained shrinkage (1993 and 1995 had brief spurts into negative territory) has happened since 1932, which was the era of the Great Depression. Even the 2008 financial crisis did not produce a negative growth rate in the money supply. The M2 annual growth rate is -2.34 percent as of this past December. This is a slight improvement over the -3.0 percent rate in the previous month.
https://www.longtermtrends.net/m2-money-supply-vs-inflation/
Conclusion
The markets and the economy continue to perplex. Interest rates are going down, which is good for stocks and consumer borrowing. But we are experiencing deflation for the first time since the Great Depression. And stocks remain incredibly overvalued. However, we had none of the economic fallout that I was predicting. In some ways it feels like the early 1990s (in America). Back then we had a recession but no real crash. Interest rates were declining. The stock market after being flat for most of the early 90s exploded higher in 1995 and continued going up until 2000. In other ways, the economy feels like Japan during the 1990s, when they experienced slow deflation and stagnant growth throughout that decade. My prediction is that this decade will be a sideways pattern for stocks, marked with rallies and declines. American income and employment rates will hold up but cost of living expenses will continue to eat into their wealth. It will be an era of “invisible” decline, much like what we saw during the past 50 years. Despite this being a bull market, there are few bargains out there.
Next monthly report: Feb 10th
