April 2024 Report – Markets are correcting

LONG TERM STANCE (6-12 MONTHS): Bull Market

SHORT TERM STANCE: correction

INFLATION FORECAST OVER NEXT 6 MONTHS: moderate inflation

INVESTMENT STANCE: 50% cash, 50% stocks

STOCK CRASH POTENTIAL (NEXT 1-6 MONTHS): LOW

ECONOMY: medium growth

Next Monthly Report: May 11

April 16, 2024

Disclaimer: Do not trade off of this advice. This blog is for informational purposes only. Any investment advice are just suggestions. The author has no experience working in the financial industry.

Stocks

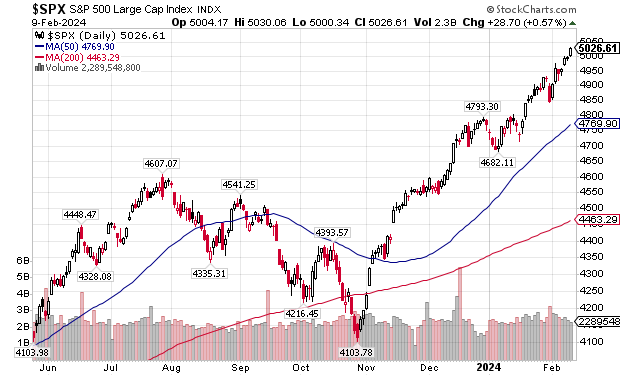
Markets are entering a correction. This was forecasted in the previous report. Stocks are still in a bull market, however. The Dow Industrials had been nearing the psychologically important 40k level and turned down. It is currently 5.5 percent below it’s all time high. The market will probably hit the 200 day moving average before bouncing.

As for the S&P 500, it is nearing the psychologically important 5000 level. My bet is that it will hit the 200 day moving average as well. Also, the 4650 level is roughly a 50 percent retracement of the late October low, which coincides with the 200 day MA.

In the March report:

(There) has been some fracturing in the markets. Less and less stocks have joined the broader market in making new highs. This indicates a pullback is coming soon.

The market had been making new highs, but less and less stocks were making new highs.

One month later . . .

I had also noted:

(There) remains a non-confirmation between the Tranports and the Industrials, which is a Dow Theory violation. The Industrials made new highs while the Transports didn’t. The Transports have performed poorly since December.

Interest rates

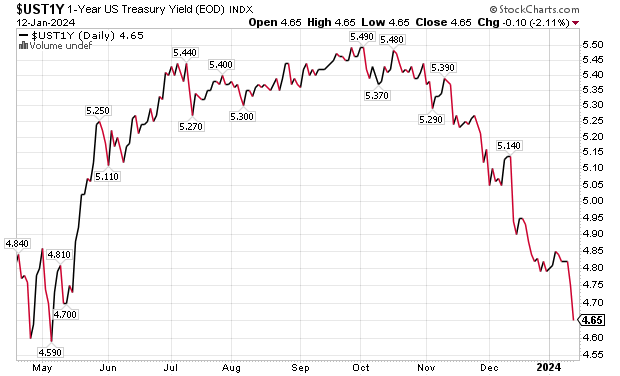
After declining from October to December, Treasury yields have gone up. I had predicted in March that rates would go back down soon. It had looked like a corrective channel.

That did not happen. In fact yields on Treasury notes have gone parabolic!

However, I believe that rates will go back down again after the parabolic rise ends. Some notes could make new highs in yields. It could be the last hurrah for high interest rates for awhile.

I would be investing in Treasury Notes now, so you can lock in the high rates. I do believe that interest rates over the long-term (5-15 years) are going to continue upward. This may not bode well for stocks over the long term.

See also:

The End of the 40-Year Bull Market in Bonds. What’s Next

A 40-year bull run in the bond market is under pressure as Treasury yields touch the ‘most important trend line of all time’

R.I.P Bond Bull Market , 1981-2021

M2 Money Supply is Shrinking

Seldomly will you hear in the media that the money supply is actually shrinking, which is the first time sustained shrinkage (1993 and 1995 had brief spurts into negative territory) has happened since 1932, which was the era of the Great Depression. Even the 2008 financial crisis did not produce a negative growth rate in the money supply. The M2 annual growth rate is -0.92 percent as of this past March. This is a steady improvement and it may well be in positive territory by the summer. M2 growth bottomed at -4.8 percent this past April.

https://www.longtermtrends.net/m2-money-supply-vs-inflation/

Conclusion

Markets are correcting right now but over the next couple of years, stocks will probably go up, as long as interest rates do not rise appreciably. My prediction is that this decade will be a sideways pattern for stocks, marked with rallies and declines. American income and employment rates will hold up but the cost of living expenses will continue to eat into wealth. It will be an era of “invisible” decline, much like what we saw during the past 50 years. Despite this being a bull market, there are few bargains out there.

Next monthly report: May 11

March 2024 Report – Correction coming

LONG TERM STANCE (6-12 MONTHS): Bull Market

SHORT TERM STANCE: correction coming

INFLATION FORECAST OVER NEXT 6 MONTHS: moderate inflation

INVESTMENT STANCE: 50% cash, 50% stocks

STOCK CRASH POTENTIAL (NEXT 1-6 MONTHS): LOW

ECONOMY: medium growth

Next Monthly Report: April 11

March 15, 2024

Disclaimer: Do not trade off of this advice. This blog is for informational purposes only. Any investment advice are just suggestions. The author has no experience working in the financial industry.

Stocks

Stocks are currently in a bull market, though a correction is likely coming soon. The Dow Industrials has been nearing the psychologically important 40k level while the S&P 500 hit 5000 back in mid February.

However, there has been some fracturing in the markets. Less and less stocks have joined the broader market in making new highs. This indicates a pullback is coming soon.

Also there remains a non-confirmation between the Tranports and the Industrials, which is a Dow Theory violation. The Industrials made new highs while the Transports didn’t. The Transports have performed poorly since December.

Interest rates

After declining from October to December, Treasury yields have gone up. I believe this is a correction and that rates will go back down once again.

Bonds have already suffered their worst bear market in history, with the 30 year bond declining 40 percent in value from 2020 to 2023. A rally in bonds was long overdue. However I believe that interest rates over the long-term (5-15 years) are going to continue upward. The next couple of years may see rates decline.

Short term interest rates however have not seen much of a change. One month Treasury yields are still around 5.5 percent, which is what they were since last August. This has kept the yield curve inverted.

See also:

The End of the 40-Year Bull Market in Bonds. What’s Next

A 40-year bull run in the bond market is under pressure as Treasury yields touch the ‘most important trend line of all time’

R.I.P Bond Bull Market , 1981-2021

M2 Money Supply is Shrinking

Seldomly will you hear in the media that the money supply is actually shrinking, which is the first time sustained shrinkage (1993 and 1995 had brief spurts into negative territory) has happened since 1932, which was the era of the Great Depression. Even the 2008 financial crisis did not produce a negative growth rate in the money supply. The M2 annual growth rate is -1.09 percent as of this past February. This is a steady improvement and it may well be in positive territory by the summer. M2 growth bottomed at -4.8 percent this past April.

https://www.longtermtrends.net/m2-money-supply-vs-inflation/

Conclusion

The bull market in stocks should continue for some time, as long as interest rates do not go up appreciably. My prediction is that this decade will be a sideways pattern for stocks, marked with rallies and declines. American income and employment rates will hold up but the cost of living expenses will continue to eat into wealth. It will be an era of “invisible” decline, much like what we saw during the past 50 years. Despite this being a bull market, there are few bargains out there.

Next monthly report: April 11

February 2024 Report – S&P 500 Hits 5000

MARKET STANCE (3-12 MONTHS): Bull Market

INFLATION FORECAST OVER NEXT 6 MONTHS: moderate inflation

INVESTMENT STANCE: 50% cash, 50% stocks

STOCK CRASH POTENTIAL (NEXT 1-6 MONTHS): LOW

ECONOMY: medium growth

Next Monthly Report: March 9

February 10, 2024

Disclaimer: Do not trade off of this advice. This blog is for informational purposes only. Any investment advice are just suggestions. The author has no experience working in the financial industry.

The official unemployment rate continues to be at historic lows. It was 3.7 percent in January, the same as November and December. 353k jobs were added in January. Total non-farm jobs openings tell a different story from the low official numbers, however. It has been falling steadily since March of 2022. This FRED graph is data from December 2000 to December 2023. Every decline in the number of job openings has occurred during a recession (shaded grey). So there is a major discrepancy between the official unemployment figures and the figure below. The economy is not as solid as you think.

Homes sales last year were at their lowest level since 1995. However, the median price of existing homes has barely come down. This was due to skyrocketing mortgage rates and the fact that those who locked in when rates were at record lows have been reluctant to sell. Mortgage rates have come down moderately since.

Home prices today are way out of line to the historic norms. The chart below shows both the median home price and inflation adjusted home prices from Jan 1954 to Oct 2023. For many decades inflation adjusted median home prices were fairly steady until 20 years ago. Today median home prices are roughly double what they were from the 1950s to the early 2000s.

Stocks

Back in December, I changed my stance on the stock market. We are currently in a bull market. The major indices never saw the technical breakdown that I expected. The Dow Industrials, the NASDAQ, and the S&P 500 have all held above their moving averages. Their 50 day averages never crossed below their 200 day averages during the October and November selloffs. The historic volatile period for equities is over.

The Dow Industrials is nearing the psychologically important 40k level while the S&P 500 recently hit 5000.

The Dow Transports and NYSE Composite have both turned up as well. Their 50 day MA is now above their 200 day MA. However there remains a non-confirmation between the Tranports and the Industrials, which is a Dow Theory violation. The Industrials made new highs while the Transports didn’t. Whether the Transports catches up to the Industrials remains to be seen.

Stocks are due for a pullback as they appear to be overbought. But the fact remains that stocks are incredibly overvalued compared to the historical mean. The chart below shows how much the average dividend yield has shrunk over the past 100 years. Stocks are a poor value today. It used to be that stocks were bought primarily for it’s dividend producing income. That’s not the case today as they are bought almost exclusively for it’s capital gains. The dividend yield currently on the S&P 500 stocks is at among it’s lowest level in history (see the May 2022 report for a more in-depth look).

Interest rates

The bear market for Treasuries is over – for now. Interest rates have been dropping steadily for the past several months. This has buoyed stocks. Long-term interest rates should be coming down further after a two month rally in rates.

Bonds have already suffered their worst bear market in history, with the 30 year bond declining 40 percent in value over the past three years. A rally in bonds was long overdue. However I believe that interest rates over the long-term (5-15 years) are going to continue upward. The next couple of years may see rates decline.

See also:

The End of the 40-Year Bull Market in Bonds. What’s Next

A 40-year bull run in the bond market is under pressure as Treasury yields touch the ‘most important trend line of all time’

R.I.P Bond Bull Market , 1981-2021

M2 Money Supply is Shrinking

Seldomly will you hear in the media that the money supply is actually shrinking, which is the first time sustained shrinkage (1993 and 1995 had brief spurts into negative territory) has happened since 1932, which was the era of the Great Depression. Even the 2008 financial crisis did not produce a negative growth rate in the money supply. The M2 annual growth rate is -2.19 percent as of this past January. This is a steady improvement. M2 growth bottomed at -4.8 percent this past April.

https://www.longtermtrends.net/m2-money-supply-vs-inflation/

Conclusion

The bull market in stocks should continue for some time, albeit corrections here and there along the way. But the fact remains that stocks are incredibly overvalued. However, we had none of the economic fallout that I was predicting. In some ways it feels like the early 1990s. Back then we had a recession but no real crash. Interest rates were declining. The stock market after being flat for most of the early 90s exploded higher in 1995 and continued going up until 2000. In other ways, the American economy feels like Japan during the 1990s, when they experienced slow deflation and stagnant growth throughout that decade. My prediction is that this decade will be a sideways pattern for stocks, marked with rallies and declines. American income and employment rates will hold up but the cost of living expenses will continue to eat into wealth. It will be an era of “invisible” decline, much like what we saw during the past 50 years. Despite this being a bull market, there are few bargains out there.

Next monthly report: March 9

January 2024 Report – Bull Market

MARKET STANCE (3-12 MONTHS): Bull Market

INFLATION FORECAST OVER NEXT 6 MONTHS: moderate inflation

INVESTMENT STANCE: 50% cash, 50% stocks

STOCK CRASH POTENTIAL (NEXT 1-6 MONTHS): LOW

ECONOMY: medium growth

Next Monthly Report: Feb 10

January 13, 2024

Disclaimer: Do not trade off of this advice. This blog is for informational purposes only. Any investment advice are just suggestions. The author has no experience working in the financial industry.

The official unemployment rate continues to be at historic lows. It was 3.7 percent in December, same as November. Total non-farm jobs openings tell a different story from the low official numbers, however. It has been falling steadily since March of 2022. This FRED graph is data from December 2000 to November 2023. Every decline in the number of job openings has occurred during a recession (shaded grey). So there is a major discrepancy between the official unemployment figures and the figure below. The economy is not as solid as you think.

The real estate market over the past year has been flat. The median price of existing homes sold has been flat for the past several months. I’ve written in the last monthly report that mortgage application were at the lowest level since the mid-1990s. That was due to skyrocketing mortgage rates and the fact that those who locked in when rates were low have been reluctant to sell. That will probably change as mortgage rates have fallen a full point from their peak in late October.

Home prices today are way out of line to the historic norms. The chart below shows both the median home price and inflation adjusted home prices from Jan 1954 to Oct 2023. For many decades inflation adjusted median home prices were fairly steady until 20 years ago. Today median home prices are roughly double what they were from the 1950s to the early 2000s.

Stocks

Back in December I changed my stance on the stock market. We are currently in a bull market. The major indices never saw the technical breakdown that I expected. The Dow Industrials, the NASDAQ, and the S&P 500 have all held above their moving averages. Their 50 day never crossed below their 200 day moving averages during the October and November selloffs. The historic volatile period for equities is over.

The Dow Transports and NYSE Composite have both turned up as well. Their 50 day MA is now above their 200 day MA. However there remains a non-confirmation between the Tranports and the Industrials, which is a Dow Theory violation. The Industrials made new highs while the Transports didn’t. Whether the Transports catches up to the Industrials remains to be seen.

Even the Banking Index has been showing signs of recovery as their bear market appears to be over.

Stocks are due for a pullback as they appear to be overbought. But the fact remains that stocks are incredibly overvalued compared to the historical mean. The chart below shows how much the average dividend yield has shrunk over the past 100 years. Stocks are a poor value today. It used to be that stocks were bought primarily for it’s dividend producing income. That’s not the case today as they are bought almost exclusively for it’s capital gains. The dividend yield currently on the S&P 500 stocks is at among it’s lowest level in history (see the May 2022 report for a more in-depth look).

Interest rates

The bear market for Treasuries appears to be over – for now. Interest rates have been dropping steadily for the past several months. This has buoyed stocks.

Bonds have already suffered their worst bear market in history, with the 30 year bond declining 40 percent in value over the past three years. A rally in bonds was long overdue. However I believe that interest rates over the long-term (5-15 years) are going to continue upward. The next couple of years may see rates decline.

See also:

The End of the 40-Year Bull Market in Bonds. What’s Next

A 40-year bull run in the bond market is under pressure as Treasury yields touch the ‘most important trend line of all time’

R.I.P Bond Bull Market , 1981-2021

M2 Money Supply is Shrinking

Seldomly will you hear in the media that the money supply is actually shrinking, which is the first time sustained shrinkage (1993 and 1995 had brief spurts into negative territory) has happened since 1932, which was the era of the Great Depression. Even the 2008 financial crisis did not produce a negative growth rate in the money supply. The M2 annual growth rate is -2.34 percent as of this past December. This is a slight improvement over the -3.0 percent rate in the previous month.

https://www.longtermtrends.net/m2-money-supply-vs-inflation/

Conclusion

The markets and the economy continue to perplex. Interest rates are going down, which is good for stocks and consumer borrowing. But we are experiencing deflation for the first time since the Great Depression. And stocks remain incredibly overvalued. However, we had none of the economic fallout that I was predicting. In some ways it feels like the early 1990s (in America). Back then we had a recession but no real crash. Interest rates were declining. The stock market after being flat for most of the early 90s exploded higher in 1995 and continued going up until 2000. In other ways, the economy feels like Japan during the 1990s, when they experienced slow deflation and stagnant growth throughout that decade. My prediction is that this decade will be a sideways pattern for stocks, marked with rallies and declines. American income and employment rates will hold up but cost of living expenses will continue to eat into their wealth. It will be an era of “invisible” decline, much like what we saw during the past 50 years. Despite this being a bull market, there are few bargains out there.

Next monthly report: Feb 10th

December 2023 Report – A New Bull Market?

SHORT-TERM FORECAST: Near a top

INTERMEDIATE FORECAST (3-12 MONTHS): Probable Uptrend

INFLATION FORECAST OVER NEXT 6 MONTHS: low inflation

INVESTMENT STANCE: 70% cash, 30% stocks

STOCK CRASH POTENTIAL (NEXT 1-6 MONTHS): GUARDED

ECONOMY: medium growth

Next Monthly Report: Jan 13th

December 9, 2023

Disclaimer: Do not trade off of this advice. This blog is for informational purposes only. Any investment advice are just suggestions. The author has no experience working in the financial industry.

The official unemployment rate continues to be at historic lows. It was 3.7 percent in November, down from 3.9 percent in October. Total non-farm jobs openings tell a different story from the low official numbers, however. It has been falling steadily since March of last year. This FRED graph is data from December 2000 to October 2023. Every decline in the number of job openings has occurred during a recession (shaded grey). So there is a major discrepancy between the official unemployment figures and the figure below. The economy is not as solid as you think.

The real estate market over the past year has been flat. The median price of existing homes sold has been flat for the past several months. I’ve written in the last monthly report that mortgage application were at the lowest level since the mid-1990s. That was due to skyrocketing mortgage rates and the fact that those who locked in when rates were low have been reluctant to sell. That may change as interest rates have fallen.

Continue reading “December 2023 Report – A New Bull Market?”

November 2023 Monthly Report – Economy weakening

INTERMEDIATE-TERM FORECAST: Down

INFLATION FORECAST OVER NEXT 6 MONTHS: low inflation or all-out deflation

MARKET POSITION: Bear market

INVESTMENT STANCE: 100% cash

STOCK CRASH POTENTIAL (NEXT 1-6 MONTHS): Elevated

ECONOMY: low growth

Next Monthly Report: Dec 9

November 11, 2023

Disclaimer: Do not trade off of this advice. This blog is for informational purposes only. Any investment advice are just suggestions. The author has no experience working in the financial industry.

The official unemployment rate continues to be at historic lows, though it has crept up lately. It was 3.9 percent in October, up from 3.5 percent in September. Total non-farm jobs openings tells a different story from the low official numbers. It has been falling steadily since March of last year. This FRED graph goes back to December 2000. Every decline in the number of job openings has occurred during a recession (shaded grey). So there is a major discrepancy between the official unemployment figures and the figure below. The economy is in worse shape than as you think.


Real Estate

I released an Interim Report on the current situation in real estate last month. Real estate is clearly in a slowdown. Mortgage application are at the lowest level since the mid-1990s. According to FRED, the median price of existing homes sold decreased from $404k in September to $394k in October. (The all-time record high was $413k set in June 2022.)

Real estate prices do tend to be loosely correlated with the stock market. Stocks set an all-time high early last year, then had a 25 percent decline and rallied strongly until summer. Home prices had an eerily similar pattern. After setting an all-time high last year, prices had fallen some 10 percent before rebounding and then falling again. Home prices too were near their all-time record highs this past summer, but did NOT surpass their all-time high of 2022. Stocks have turned down and real estate so far has done the same.

Stocks

Stocks have rallied since the beginning of this month after declining for two months. The Dow Industrials, S&P 500, and NASDAQ have all popped above their 50 day and 200 day moving averages. However, the Dow Transports and NYSE Composite remain below their moving averages. This indicates a fractured market. After this rally is over, stocks will likely break down hard.


M2 Money Supply is Shrinking

Seldomly will you hear in the media that the money supply is actually shrinking, which is the first time sustained shrinkage (1993 and 1995 had brief spurts into negative territory) has happened since 1932, which was the era of the Great Depression. Even the 2008 financial crisis did not produce a negative growth rate in the money supply. Currently the quarterly M2 annual growth rate is -3.77 percent.

https://www.longtermtrends.net/m2-money-supply-vs-inflation/

See also:

The End of the 40-Year Bull Market in Bonds. What’s Next

A 40-year bull run in the bond market is under pressure as Treasury yields touch the ‘most important trend line of all time’

R.I.P Bond Bull Market , 1981-2021

Interest Rates

One of the reasons the market has turned up may have been due to falling interest rates of late. Whether interest rates have peaked or not remains to be seen. Bonds have already suffered their worst bear market in history, with the 30 year bond declining 40 percent in value over the past three years.

The decline in rates could be indicating the beginning to flight to safety. However rates won’t decline in earnest until a real market panic ensues. We are nowhere close to panic yet.

Quite a bit of damage has already been done in the banking sector, mainly due to the collapse in bond value, which many banks were heavily invested in. Silvergate and SVB were early casualties but the entire banking sector remains weak.


Conclusion

Things may be coming to a head pretty soon. Stay tuned. Stay out of stocks and other speculative investments. Stay in cash and cash equivalents.

Next monthly report: Dec 9

October 29, 2023 Interim Report: Stocks are in a bear market

October 29, 2023

In one of the major US stock index, the NYSE Composite has entered bear market territory. The 50 day moving average crossed below the 200 day moving average last week. This in a highly watched indicator among investors.

The Dow Utilities has been in an entrenched bear market since the summer of last year.

Stocks across the board have fallen hard. However the 50 day and 200 day moving averages in the NASDAQ, the Dow Industrials, and S&P 500 have not crossed over yet. We should see this happen over the next weeks.

Stocks may be oversold right now and a rally could be coming shortly. But that doesn’t change the big picture. Treasury bonds are enduring it’s worst bear market in history. Housing, automobiles, and many other things are priced sky high and are in a bubble. We are experiencing deflation in the money supply. Non-farm employment has dropped for the last several months. I’ve discussed those point in previous monthly reports. Things are going to come to a head real soon.

We can say that the rise in the stock market from the fall of last year until July was indeed a bear market rally. I got frustrated watching the markets rise during that time. I knew that many things indicated an economic bubble but was confused that the markets were going up strongly. I had thought that there was a chance that the rally could turn out to be some sort of bull market.

We need a recession

Yes, we need a recession. Yes, I want a recession. I want bargains. Everything is too damn expensive right now. We have excesses in seemingly everything – real estate, rent, automobiles, grocery prices, restaurant prices, car insurance premiums, etc. We are in a massive bubble. We need a readjustment and a reset. It is not going to be pretty. In addition to an economic fallout, we will most likely have disarray, polarization, radical political movements, violence, etc. It is similar to the situation in the wake of Covid three years ago. I don’t want those things to happen but it is going to happen. If you are not prepared you are going to get hurt. If you are prepared, a recession or depression could be a blessing. Stay away from debt, save money, and live below your means. I have been living that way for years. You should do the same.

Interim Report: The Real Estate Situation

October 29, 2023

The 30-year mortgage rate is hovering around 8 percent right now, the highest in more than 20 years. Home sales for 2023 are projected to be at their lowest level since the Great Recession of 2008. Yet, property prices have stayed stubbornly high. Homes have become increasingly less affordable for most. According to Redin, a homebuyer needs nearly $115,000 ($40k more than the average income) to afford today’s median priced home (up 15 percent from a year ago). That’s despite average wages being up only 5 percent.

Prices have only come down a modest amount so far.

The sharp rise in real estate prices since Covid was due to plummeting mortgage rates, which made it easier to take out a larger mortgage. However, mortgage rates have greatly increased over the past year and a half. But home prices have not come down much. Why is that? According to Redfin, prices remain high because of low inventory. Inventory of existing homes are at the lowest level since 1995. Demand for housing is down, but so is supply. People are remaining put and are not selling because many locked in (or refinanced) when mortgage rates were under 3 percent. They are enjoying low monthly payments now, so why sell? Those who pay cash and those who are first time buyers are the ones who are buying in today’s market. Additionally, the economy is relatively solid right now. We are enjoying near full employment – for now.

It is not just real estate prices that are high, but many other things such automobile prices, restaurant prices, medical services, etc. Everything is high right now and there aren’t many good bargains. This was mainly the result of record monetary pumping two years ago. But as you see in the chart below, the growth in the money supply has come crashing down. It has been in negative territory for several months now, the first time that has happened since the Great Depression.

The economy is on a cusp of a major downturn, and probably a serious one. Total non-farm job openings have declined since early last year.

A full-blown recession is nearly at hand. That is when we will finally see prices come down on many things, including real estate. Be prepared. This may be the last great selling opportunity. Also, keep in mind that real estate has essentially no liquidity in a downturn. It could take months, even years, to sell your home in a downmarket.

The truth about real estate

Real estate is NOT an investment (unless you derive income from it in the form of rent). It is a consumption item. Homeowners do not realize how expensive it is to own a home. In addition to mortgage and interest, you have property tax, insurance, maintenance, and repairs. Historically, homes have appreciated at the rate of inflation. The charts below illustrates that. The popping of the real estate bubble 15 years ago brought prices back to reality.

… but the bubble started back up again around 2012 thanks to interest rates declining to record low levels. The late 90s onward have been an anomaly created by low borrowing costs.

Whenever anything is touted as an investment, people will pour money into it. If folks had realistic expectations in regards to real estate, they would spend money less on it. There would be less home flipping and speculation. There would be less second homes bought. There would be less people wanting to become realtors. People would buy less home and spend less on home improvement projects. You see, the industry would make less money by calling homes what they really are – a consumption item. By touting homes as an investment, the industry profits big. The banks, the realtors, the home improvement companies, and Wall Street are the ones making money off of that claim, not you. You are the sucker that provides fuel for the fire by being a consumer and debt slave.

October 2023 Report – Markets are weakening

INTERMEDIATE-TERM FORECAST: Down

INFLATION FORECAST OVER NEXT 6 MONTHS: low inflation or all-out deflation

MARKET POSITION: market rally breaking down hard

INVESTMENT STANCE: 100% cash

STOCK CRASH POTENTIAL (NEXT 1-6 MONTHS): Elevated

ECONOMY: low growth

Next Monthly Report: Nov 11

October 14, 2023

Disclaimer: Do not trade off of this advice. This blog is for informational purposes only. Any investment advice are just suggestions. The author has no experience working in the financial industry.

The official unemployment rate continues to be at historic lows. It was 3.5 percent in September. Unexpectedly, 366k jobs were added that month. The economy appears to be on solid ground, at least according to official numbers. However, total non-farm jobs openings has been falling steadily since March of last year. This FRED graph goes back to December 2000. Every decline in the number of job openings has occurred during a recession (shaded grey). So there is a major discrepancy between the unemployment figures and the figure below. The economy is not as solid as you think.


The median sales price of existing homes had a slight uptick in August. It went from $406k in July to $407k in August. (The all-time record high was $413k set in June 2022.)

Real estate prices do tend to be loosely correlated with the stock market. Stocks set an all-time high early last year, then had a 25 percent decline and then rallied strongly since. Home prices had an eerily similar pattern. After setting an all-time high in the middle of last year, prices had fallen some 10 percent before rebounding strongly. Home prices too are near their all-time record highs, but have NOT surpassed their all-time highs – same with the stock market. Stocks have turned down and real estate will almost assuredly follow.

Stocks

The Dow Industrials, NYSE Composite, and Dow Transports are all below both their 50 day and 200 day moving averages. This is an important technical indicator. The NASDAQ and S&P 500 are below their 50 day moving average but still above their 200 day moving average. Both the Dow Industrials and NYSE Composite sported a “head and shoulders” pattern. Stocks appear on the verge of breaking down hard.

M2 Money Supply is Shrinking

Seldomly will you hear in the media that the money supply is actually shrinking, which is the first time sustained shrinkage (1993 and 1995 had brief spurts into negative territory) has happened since 1932, which was the era of the Great Depression. Even the 2008 financial crisis did not produce a negative growth rate in the money supply. Currently the quarterly M2 annual growth rate is -3.23 percent.

https://www.longtermtrends.net/m2-money-supply-vs-inflation/

See also:

The End of the 40-Year Bull Market in Bonds. What’s Next

A 40-year bull run in the bond market is under pressure as Treasury yields touch the ‘most important trend line of all time’

R.I.P Bond Bull Market , 1981-2021

Interest Rates

We know that short term interest rates have been galloping higher. But long term rates have turn up sharply as well. This could be the final ingredient to set a recession in motion. Thirty-year mortgage rates set a new high of 7.57 percent this past week. This will surely impact the real estate market in the near future.

One of the biggest financial news makers of late has been the bear market in bonds. US Treasury bonds have been entrenched in the worst decline in history. What has been long regarded as a “safe haven”, the 30 year bond has suffered a 40 percent loss during it’s three year decline in prices.

30-year treasury yields hit nearly 5 percent last week.

Conclusion

Things may be coming to a head pretty soon. Stay tuned.

Next monthly report: Nov 11

Interim Report: Ominous pattern in stocks

9/24/23

Stocks have been breaking down during the past two months. There is an ominous “head and shoulders” pattern in the S&P 500, the Dow Industrials, and the NASDAQ. The Head and Shoulders pattern is a reliable technical formation. Prices could continue to tumble over the next few months. October has been known for being historically volatile.

Each of the indices have peaked at different times as momentum has waned. The NASDAQ topped in mid-July, while the Transports peaked in late July, and the Industrials peaked around the beginning of August.

The breakdown in stocks is against the backdrop of interest rates that continue to rise. As noted in the September Monthly Report, long-term interest rates are now rising sharply. The 10 year note is currently at a 16 year high, while the 30 year bond is at a 12 year high.

Mortgage rates are also at a 20 year high. And the number of new non-farm hires have declined for the past year and a half as noted in previous Monthly Reports.

Is Real Estate Sending a Signal? September 2023 Report

INTERMEDIATE-TERM FORECAST: ?

INFLATION FORECAST OVER NEXT 6 MONTHS: moderate inflation

MARKET POSITION: Bull market or large bear market rally

INVESTMENT STANCE: 75% cash and 25% stocks

STOCK CRASH POTENTIAL (NEXT 1-6 MONTHS): Guarded

ECONOMY: low growth

Next Monthly Report: Oct 14

September 10, 2023

Disclaimer: Do not trade off of this advice. This blog is for informational purposes only. Any investment advice are just suggestions. The author has no experience working in the financial industry.

Not much has changed over the past several months. The official unemployment rate continues to be at historic lows. It was 3.8 percent in August and 187k jobs were added that month. The economy appears to be on solid ground, at least according to official numbers. However, total non-farm jobs openings has been falling steadily since March of last year. This FRED graph goes back to December 2000. Every decline in the number of job openings has occurred during a recession (shaded grey). So there is a major discrepancy between the unemployment figures and the figure below. The economy is not as solid as you think.

Additionally, the median sales price of existing homes dipped for the first time since January. It went down from $410k in June to $407k in July. (The all-time record high was $413k set in June 2022.) That may seem like a small drop, but it could be the harbinger of what may come. Real estate prices do not fluctuate like stock prices.

Real estate prices do tend to be loosely correlated with the stock market. Stocks set an all-time high early last year, then had a 25 percent decline and then rallied strongly since. Stocks are near their all-time record highs. Home prices had an eerily similar pattern. After setting an all-time high in the middle of last year, prices had fallen some 10 percent before rebounding strongly. Home prices too are near their all-time record highs. Again, this recent dip could be a preview of what’s next to come.


M2 Money Supply is Shrinking

Seldomly will you hear in the media that the money supply is actually shrinking, which is the first time sustained shrinkage (1993 and 1995 had brief spurts into negative territory) has happened since 1932, which was the era of the Great Depression. Even the 2008 financial crisis did not produce a negative growth rate in the money supply. Currently the quarterly M2 annual growth rate is -3.57 percent.

https://www.longtermtrends.net/m2-money-supply-vs-inflation/

See also:

The End of the 40-Year Bull Market in Bonds. What’s Next

A 40-year bull run in the bond market is under pressure as Treasury yields touch the ‘most important trend line of all time’

R.I.P Bond Bull Market , 1981-2021

Interest Rates

We know that short term interest rates have been galloping higher. But long term rates have started to turn up sharply as well. This could be the final ingredient to set a recession in motion. Mortgage rates made a new high of 7.23 percent last week. This may have been a factor in creating the recent decline in home prices.

Conclusion

Things may be coming to a head pretty soon. Stay tuned.

Next monthly report: Oct 14

August 2023 Report

INTERMEDIATE-TERM FORECAST: Up

INFLATION FORECAST OVER NEXT 6 MONTHS: moderate inflation

MARKET POSITION: Bull market or large bear market rally

INVESTMENT STANCE: 75% cash and 25% stocks

STOCK CRASH POTENTIAL (NEXT 1-6 MONTHS): Guarded

ECONOMY: low growth

Next Monthly Report: Sept 9

August 12, 2023

Disclaimer: Do not trade off of this advice. This blog is for informational purposes only. Any investment advice are just suggestions. The author has no experience working in the financial industry.

Not much has changed over the past several months. The official unemployment rate continues to be at historic lows. It was 3.5 percent in July and 187k jobs were added that month. The median sale price of existing homes have continued rising. It was up from $396k in May to $410k in June. The all-time record high was $413k set in June 2022. The economy appears to be on solid ground, at least according to official numbers. However, total non-farm jobs openings has been falling steadily since March of last year. This FRED graph goes back to December 2000. Every decline in number of job openings has occurred during a recession (shaded grey). So there is a major discrepancy between the unemployment figures and the figure below. The economy is not as solid as you think.


Continue reading “August 2023 Report”